Ivane Javakhishvili Tbilisi State University
Paata Gugushvili Institute of Economics International Scientific

THE TERM SPREAD AS LEADING ECONOMIC INDICATOR: CASE OF GEORGIA
Annotation.The role of financial sector in supporting economic growth and development is well acknowledged. The term spread (the difference between the yields on long-term and short-term Treasury securities) has been found useful for predicting economic variables as output growth, inflation, industrial production, consumption. The temp spread is one of leading economic indicator according NBER methodology. Leading economic indicators are widely used in forecasting of economic activity. Many empirical studies find that the term spread predicts future economic activity. There is no universally theory as to why a relationship between the term spread and economic activity should be positive or negative. The article shortly explain how the term spread might predict future economic activity.
This paper analyses some aspects of dynamics of the spread between short and long-term interest rates in countries with transition economies. In Georgia, the banking sector plays an important and dominant role in the financial sector, especially with respect to mobilization of savings and provision of credit. The research paper analyses term spread dynamics in Georgia and compare it with post-communist countries and transition economies spread dynamics.
Keywords: Forecasting, Leading Economic Indicators, Term Spread, Transition Economies.
I. Introduction
For many years a system of leading economic indicators, first developed by the National Bureau of Economic Research (NBER), has been widely used in the United States to appraise the state of the business cycle. The Organization for Economic Cooperation and Development (OECD) also set up a working party to develop this type of analysis.
Georgia is country with transitional economy. Given the volatile nature of transformed economic, there is a need for businesses and government agencies to have access to an accurate leading indicator of transformed economic performance (In particular for Georgia).
The analysis of leading economic indicators helps policymakers evaluate the short-term direction of economic activity. Such type of analysis is well established in advanced economies, but it has received little attention in many emerging market and developing economies. This paper presents term spread features as one of leading indicators for a small open economy. The results show that, even with limited monthly observations, it is possible to establish meaningful economic and statistically significant relations between indicators from economic activity.[15].
II. Literature Review
The empirical evidence linking the nominal yield curve to changes in output with the theoretical relationship depends on the persistence of inflation. If inflation were a random walk, implying that shocks to inflation are permanent, then inflation shocks would have no impact on the slope of the nominal yield curve because expected inflation would change by an identical amount at all horizons. However, if inflation has little persistence, an inflation shock will affect near-term expected inflation more than long-term expected inflation, causing the slope of the nominal yield curve to change. Hence, the extent to which changes in the slope of the nominal yield curve reflect changes in the real yield curve depends on the persistence of inflation which, in turn, reflects the underlying monetary regime.
Much of the empirical literature has focused on estimating the precision with which the term spread forecasts economic activity, rather than on attempting to discriminate between the monetary policy and consumption-smoothing explanations.
Several studies find that the term spread has significant predictive power for economic growth independent of the information contained in measures of current and future monetary policy, suggesting that monetary policy alone cannot explain all of the observed relationship. Several studies find that the spread has forecast output growth less accurately since the mid-1980s, which some attribute to greater stability of output growth and other key macroeconomic data (e.g., D’Agostino, Giannone, and Surico, 2006) [17].
Stock and Watson (2003) examine the stability of the forecasting relationship between the term spread and output growth for the United States and other countries and consider both in-sample and out-of-sample forecasts. Like prior studies, Stock and Watson (2003) find that the term spread forecasts U.S. output growth less accurately after 1985. The study also finds that the spread forecasts output less accurately during 1985-99 than a simple autoregressive model. A recent study by Giacomini and Rossi (2006) reexamines the forecasting performance of the yield curve for output growth using forecast breakdown tests developed by Giacomini and Rossi (2009). Giacomini and Rossi (2006) show that output growth models are characterized by a breakdown of predictability. In particular, they find strong evidence of forecast breakdowns at the one-year horizon during 1974-76 and 1979-87.
As noted previously, a change in the relative responsiveness of monetary policy to output growth and inflation could affect how well the term spread predicts output growth. Bordo and Haubrich (2004, 2008) investigate the ability of the term spread to forecast U.S. output growth across different monetary regimes from 1875 to 1997. The authors examine periods distinguished by major changes in the monetary and interest rate environment, including the founding of the Federal Reserve System in 1914, World War II, the Treasury-Fed Accord of 1951, and the closing of the U.S. gold window and collapse of the Bretton Woods system in 1971. Bordo and Haubrich (2004, 2008) find that the term spread improves the forecast of output growth, as indicated by the mean squared forecast error, in three of the nine subperiods they consider: (i) the period preceding the establishment of the Federal Reserve System (1875-1913), (ii) the first 13 years after the collapse of the Bretton Woods system (1971-84), and, to a lesser extent, (iii) the 1985-97 period [18].
III. Empirical Analysis
Figure 1 shows the difference between the yields on 10-year and 3-month U.S. Treasury securities for 1953-2008. The shaded regions indicate recession periods as defined by the National Bureau of Economic Research. As Figure 1 shows, every U.S. recession since 1953 was preceded by a large decline in the yield on 10-year Treasury securities relative to the yield on 3-month Treasury securities, and several recessions were preceded by an inversion of the yield curve.
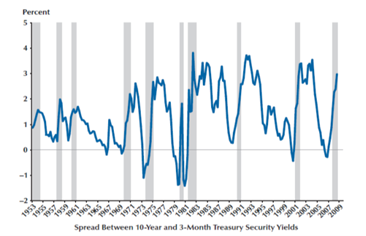
Figure 1. U.S Term Spread and Recessions
Source: National Bureau of Economic Research, “Information on Recessions and Recoveries, the NBER Business Cycle Dating Committee, and Related Topics”;
Relations between spread and recessions are similar in case England and Germany.
For analysis we have discussed three Post-Communist transformation countries: Georgia, Latvia and Russia. For Georgia we investigate period from 2004 to 2016 years and used statistical data from National Bank of Georgia and National Statistics Office of Georgia. Figure 2 picture term spread dynamics for this period.
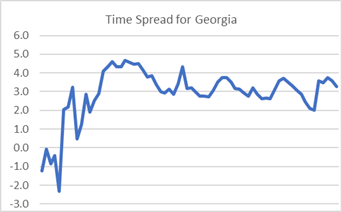
Figure 2. Spread between long-term and short-term yields for Georgia
Source: Authors calculations, based on data from National bank of Georgia statistical release.
The graph below shows term spread dynamic for Russia.
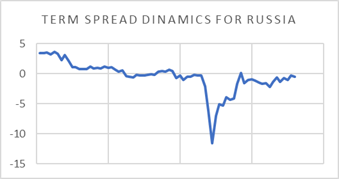
Figure 3. Spread between long-term and short-term yields for Russia
Source: Authors calculations, based on data from Russian Federal State Statistic Service release.
Term spread for Lithuania

Figure 4. Spread between long-term and short-term yields for Lithuania
Source: Authors calculations, based on data from Statists Lithuania release.
We compare term spread for three countries mentioned above. From the graphs it is well illustrated that in the case of Georgia and Latvia, the term spread is quite high at the early stage of transformation, and in the aftermath of the stabilization of economic development, this figure is reduced.
As regards Russia's statistical data, Spread is sometimes even negative. This has been detected with the peculiarities of the development of the Russian banking sector.
The evidence on the accuracy of the term spread in predicting economic activity comes from the estimation of linear models, such as the following linear regression:
![]() (1)
(1)
where ΔYt is the growth rate of output; Spread - is the difference between the yields on long-term and short-term Treasury securities; Y(L) is a lagged polynomial, typically of length four (current and three lags, assuming quarterly data); εt - is an error term.
We allow for the possibility that the persistence of output growth means that past values of GDP growth are also useful predictors of cumulative growth. We based on statistical data about spread dynamic and GDP in Georgia built model:
![]() (2)
(2)
As we see there are evidence significant relation between time spread and GDP growth in Georgia. The model allows us to evaluate term spread prediction ability for economic activity for Georgia. As we see in the model independent variables are term spread and lagged indicator of output. Identification of the model was based on the Geostat and the National Bank of Georgiastatitical data. After testing procedure shows that the model is statistically significant.
IV. Conclusion
The literature on the relationship between the term spread and economic activity is large and rapidly expanding. Much of the literature examines empirically how well the term spread forecasts economic growth, with less emphasis on why the term spread predicts economic activity.
This study has objective into determine the degree to which the Georgian term spread can forecast real GDP growth. Our results suggest that the term spread has been useful for forecasting cumulative real GDP growth. More specifically, in models in which the term spread is the only regressor, there is some evidence to suggest that the term spread had predictive ability.
References
- Bordo, Michael D. and Haubrich, Joseph G. “The Yield Curve as a Predictor of Growth: Long-run Evidence, 1875-1997.” Review of Economics and Statistics, February 2008, 90(1), pp. 182-85.
- Benati, Luca. “UK Monetary Regimes and Macroeconomic Stylized Facts.” Bank of England Working Paper 290, Bank of England, March 2006; www.bankofengland.co.uk/publications/workingpapers/wp290.pdf.
- Brock, P. L. and L. Rojas-Suarez (2000) “Understanding the Behaviour of Bank Spreads in Latin America,” Journal of Development Economics, 63(1), 113–34.
- Claessens, S., A. and L. Laeven (2004) “What Drives Bank Competition? Some International Evidence,” Journal of Money, Credit & Banking , 36 (3) Part 2, 563-583.
- National Bureau of Economic Research, “Information on Recessions and Recoveries, the NBER Business Cycle Dating Committee, and Related Topics”; www.nber.org/cycles/main.html.
- Estrela A., Trubin Mary R. The Yield Curve as a Leading Indicator: Some Practical Issues. Federal Reserve Bank of New York. Current Issues in Economics and Finance. Vol.12, #5, 2006.
- Estrella, Arturo. “Why Does the Yield Curve Predict Output and Inflation?”. Economic Journal, July 2005, 115 (505), pp. 722-44.
- Estrella, Arturo and Mishkin, Frederic S. “The Predictive Power of the Term Structure of Interest Rates in Europe and the United States: Implications for the European Central Bank.” European Economic Review, July 1997, 41(7), pp. 1375-401.
- Giacomini, Raffaella and Rossi, Barbara. “How Stable Is the Forecasting Performance of the Yield Curve for Output Growth?” Oxford Bulletin of Economics and Statistics, December 2006, 68(Suppl. 1), pp. 783-95.
- Rendu de Lint, Christel and Stolin, David. “The Predictive Power of the Yield Curve: A Theoretical Assessment.” Journal of Monetary Economics, October 2003, 50(7), pp. 1603-22.
- Rosenberg, Joshua V. and Maurer, Samuel. “Signal or Noise? Implications of the Term Premium for Recession Forecasting.” Federal Reserve Bank of New York. Economic Policy Review , July 2008, 14(1),pp. 1-11; ww.newyorkfed.org/research/epr/ 08v14n1/0807rose.pdf.
- Sensier, Marianne; Artis, Michael J.; Osborn, Denise R.and Birchenhall, Chris. “Domestic and International Influences on Business Cycle Regimes in Europe.” International Journal of Forecasting, April/June 2004, 20(2), pp. 343-57.
- Totladze L. Diffusion Index Based on Leading Economic Indicator a Forecasting Instrument (In Case Georgia). Geneva International Conference in Advanced Research. Geneva, 2017.
- Venetis, Ioannis A.; Paya, Ivan and Peel, David A. “Re-Examination of the Predictability of Economic Activity Using the Yield Spread: A Nonlinear Approach.” International Review of Economics and Finance, 2003, 12(2), pp. 187-207.
- Wright, Jonathan, H. “The Yield Curve and Predicting Recessions.” Finance and Economics Discussion Series No. 2006-07, Federal Reserve Board of Governors, February 2006; www.federalreserve.gov/pubs/feds/2006/200607/200607pap.pdf.
- Wheelock David C., Wohar Mark E. Can the Term Spread Predict Output Growth and Recessions? A Survey of the Literature. Federal Reserve Bank of St. Louis Review, 91 (5, Part 1), 2009.
- www.nbg.gov.ge
- www.geostat.ge
- Kogan R., DaSilva, Rejeski J. Difference Between Economic Growth Rates and Treasury Interest Rates Significantly Affects Long-Term Budget Outlook. February 27, 2015. SDPP. http://www.cbpp.org/research/federal-budget/ difference-between-economic-growth-rates-and - treasury-interest-rates.
- Totladze L. Diffusion Index for Georgia: Selection Leading Economic Indicators. International Reviewed Scientific-Analytical Journal “Economisti”, #2, 2016;